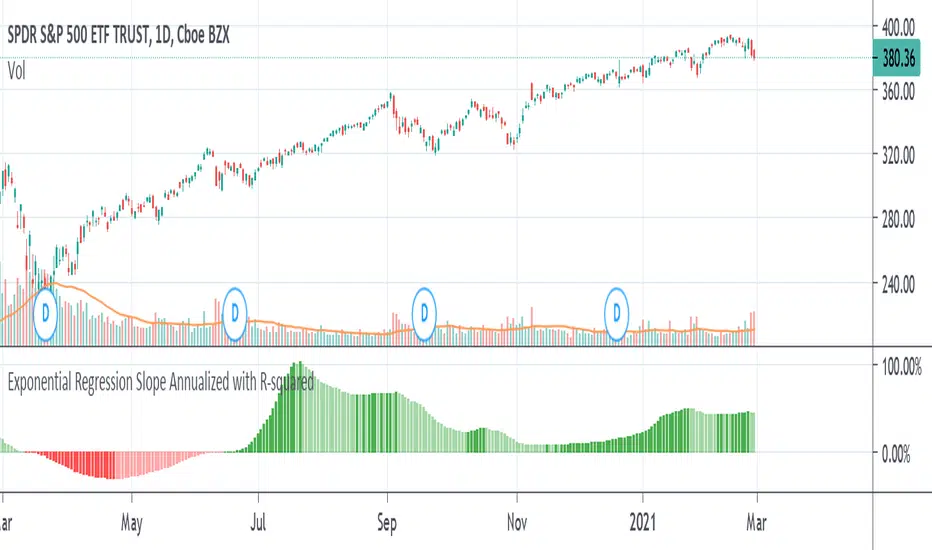
Exponential Regression Slope Annualized with R-squared HistogramMy other indicator shows the linear regression slope of the source. This one finds the exponential regression slope and optionally multiplies it by R-squared and optionally annualizes it. Multiplying by R-squared makes sure that the price movement was significant in order to avoid volatile movements that can throw off the slope value. Annualizing the exponential slope will let you see how much percentage you will make in a year if the price continues at its current pace.
The annualized number is the number of trading days in a year. This and the length might need adjusting for the extra bars that might be in futures or other markets. The number does not have to be a year. For example, it can be a month if you set the number to 20 or so trading days to find how much you would make in a month if price continues at its current pace, etc. This can also be used as an alternative to relative strength or rate of change.
Cerca negli script per "relative strength"
Sukrut relative strengthI am publising Relative Strength Comparative.
It is be used to compare a Stock's Performance against another stock/index (Default NIFTY50)
Example: ITC vs NIFTY 50 it will be ITC / NIFTY
[blackcat] L2 Ehlers Adaptive Relative Strength IndexLevel: 2
Background
John F. Ehlers introuced Adaptive Relative Strength Index in his "Rocket Science for Traders" chapter 21 on 2001.
Function
The concept of taking a difference of lagging line from the original function to produce a leading function suggests extending the concept to moving averages. There is no direct theory for this, but it seems to work pretty well. If taking a 7-bar WMA of prices, that average lags the prices by 2 bars. If taking a 7-bar WMA of the first average, this second average is delayed another 2 bars. If taking the difference between the two averages and add that difference to the first average, the result should be a smoothed line of the original price function with no lag. Sure, Dr. Ehlers tried to use more lag for the second moving average, which
should produce a better predictive curve. However, remember the lesson of Chapter 3 of the book. An analysis curve cannot precede an event. You cannot predict an event before it occurs. If then taking a 4-bar WMA of the smoothed line to create a 1-bar lag, this lagging line becomes a signal when the lines cross. This is as close to an ideal indicator as we can get.
Key Signal
Predict ---> moving average fast line
Trigger ---> moving average slow line
Pros and Cons
100% John F. Ehlers definition translation of original work, even variable names are the same. This help readers who would like to use pine to read his book. If you had read his works, then you will be quite familiar with my code style.
Remarks
The 17th script for Blackcat1402 John F. Ehlers Week publication.
Readme
In real life, I am a prolific inventor. I have successfully applied for more than 60 international and regional patents in the past 12 years. But in the past two years or so, I have tried to transfer my creativity to the development of trading strategies. Tradingview is the ideal platform for me. I am selecting and contributing some of the hundreds of scripts to publish in Tradingview community. Welcome everyone to interact with me to discuss these interesting pine scripts.
The scripts posted are categorized into 5 levels according to my efforts or manhours put into these works.
Level 1 : interesting script snippets or distinctive improvement from classic indicators or strategy. Level 1 scripts can usually appear in more complex indicators as a function module or element.
Level 2 : composite indicator/strategy. By selecting or combining several independent or dependent functions or sub indicators in proper way, the composite script exhibits a resonance phenomenon which can filter out noise or fake trading signal to enhance trading confidence level.
Level 3 : comprehensive indicator/strategy. They are simple trading systems based on my strategies. They are commonly containing several or all of entry signal, close signal, stop loss, take profit, re-entry, risk management, and position sizing techniques. Even some interesting fundamental and mass psychological aspects are incorporated.
Level 4 : script snippets or functions that do not disclose source code. Interesting element that can reveal market laws and work as raw material for indicators and strategies. If you find Level 1~2 scripts are helpful, Level 4 is a private version that took me far more efforts to develop.
Level 5 : indicator/strategy that do not disclose source code. private version of Level 3 script with my accumulated script processing skills or a large number of custom functions. I had a private function library built in past two years. Level 5 scripts use many of them to achieve private trading strategy.

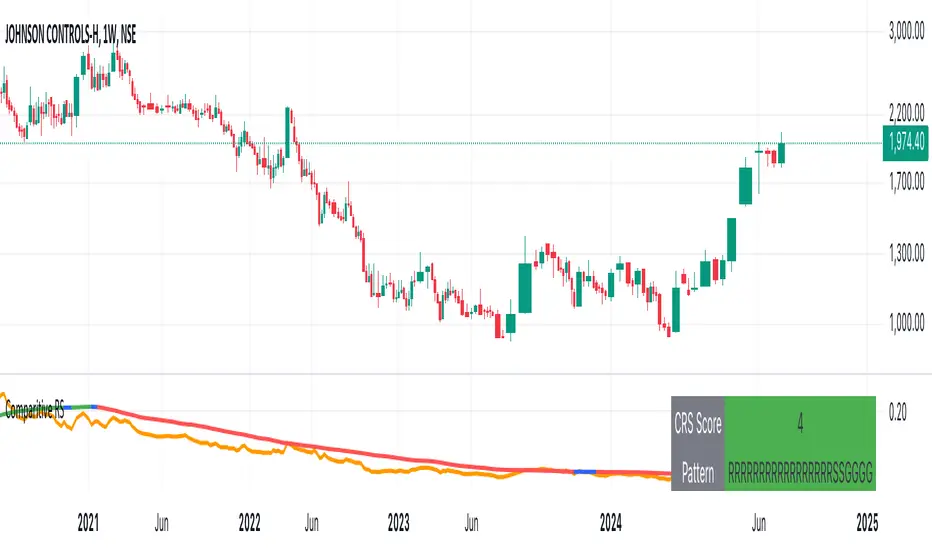
Comparative Relative StrengthPlots the relative strength between a scrip and the broader index (Nifty50 in this case) in a lower pane of the chart. Scrip shared by ST_PSI - TradeWithTrend.

Comparative Relative Strength of a stockPerform comparative relative strength of a stock. Default base is NIFTY 50.
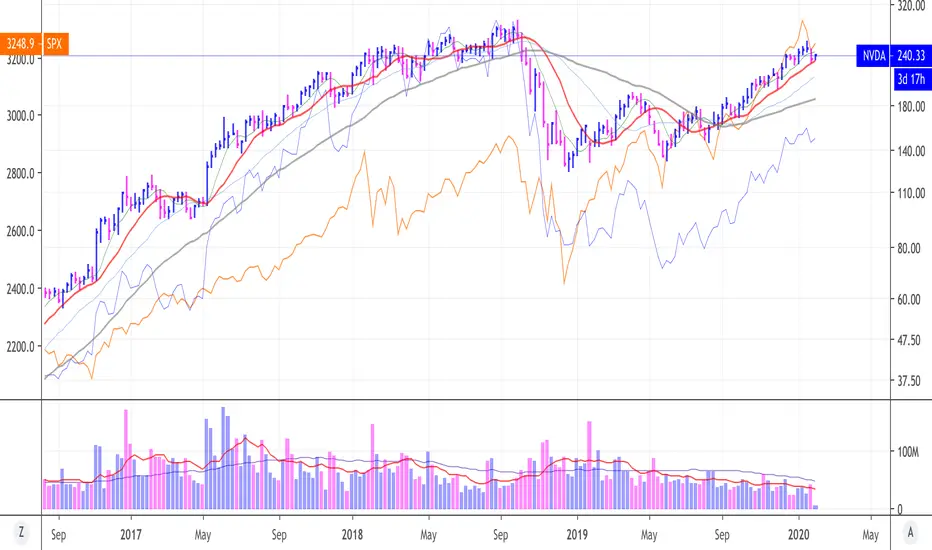
IBD Relative Strength + Linear RegressionThis is a slight extension to the excellent script by: jamiespips
It shows the Relative Strength of a Stock compared to a suitable Index.
My extension consists of:
- A selection of comparative indices.
- A short EMA-3 to the RS-curve to smooth it out.
- A linear regression trend line to the last part of the RS-curve.

VWAP Relative Strength Index [CC]This is a custom indicator of mine that uses the volume weighted average price instead of the close price as the source for calculations of the relative strength index. Buy when the indicator line is green and sell when it is red.
This was a custom request so let me know if there are any other scripts you would like to see me do or if you want something custom done!

Weighted Moving Average of Relative Strength IndexJust weighted moving average of Relative Strength Index to see a clearer picture.

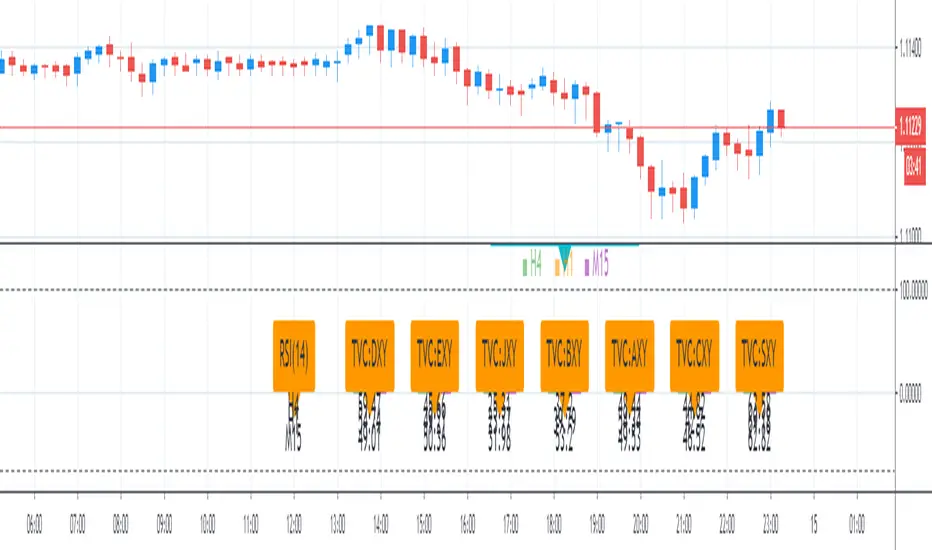
Currency Relative Strength IndexCurrency Relative Strength Index
This scripts show current RSI value and histogram of 7 Currency index on 3 time frame: 4H, 1H, 15M
//=== RSI Function ===\\
rsi_period=input(14)
M15_RSI( sym ) =>
M15_RSI = security( sym , "15", rsi (close,rsi_period))
H1_RSI( sym ) =>
H1_RSI = security( sym , "60", rsi (close,rsi_period))
H4_RSI( sym ) =>
H4_RSI = security( sym , "240", rsi (close,rsi_period))
//=== Currency Index ===\\
1. DXY - USD Index - U.S. Dollar Index
2. EXY - EUR Index - Euro Currency Index
3. JXY - JPY Index - Japanese Yen Index
4. BXY - GBP Index - British Pound Index
5. AXY - AUD index - Australian Dollar Index
6. CXY - CAD Index - Canadian Dollar Index
7. SXY - CHF Index - Swiss Franc Currency Index
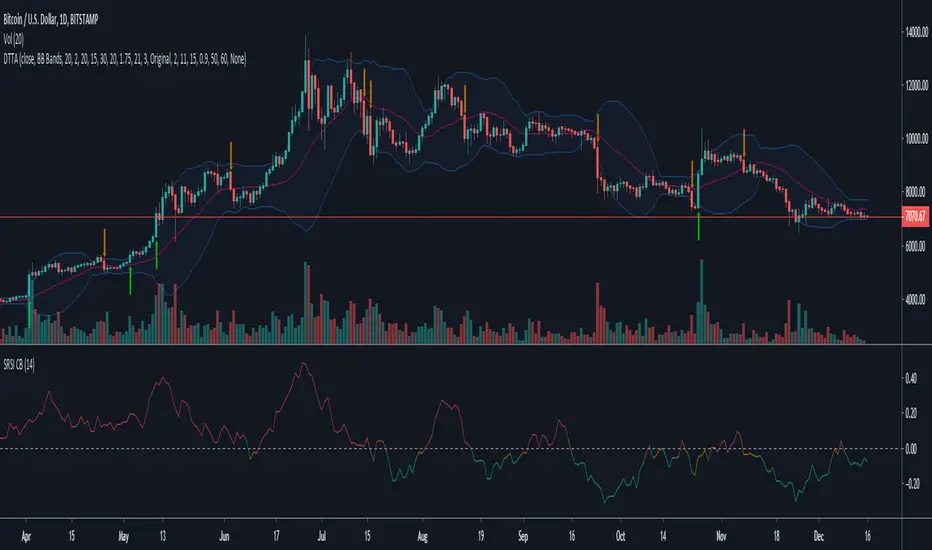
Sell Relative Strength Index [ChuckBanger]This is Sell Relative Strength Index (SRSI or “sell gravitation index”). This indicator was developed by Howard Wand as featured in the February 2019 issue of TASC magazine.
"Traders accumulate profits trade by trade, with the goal of maximizing profits. But selloffs happen and when they do, you see significant price drops that are fast. Here’s an indicator that uses the profit accumulation size to estimate subsequent selloff size.
Green lines represent buy, red represents sell and yellow represents a balance between buy and sell signals on the SRSI."
Combo Backtest 123 Reversal & Comparative Relative Strength This is combo strategies for get a cumulative signal.
First strategy
This System was created from the Book "How I Tripled My Money In The
Futures Market" by Ulf Jensen, Page 183. This is reverse type of strategies.
The strategy buys at market, if close price is higher than the previous close
during 2 days and the meaning of 9-days Stochastic Slow Oscillator is lower than 50.
The strategy sells at market, if close price is lower than the previous close price
during 2 days and the meaning of 9-days Stochastic Fast Oscillator is higher than 50.
Second strategy
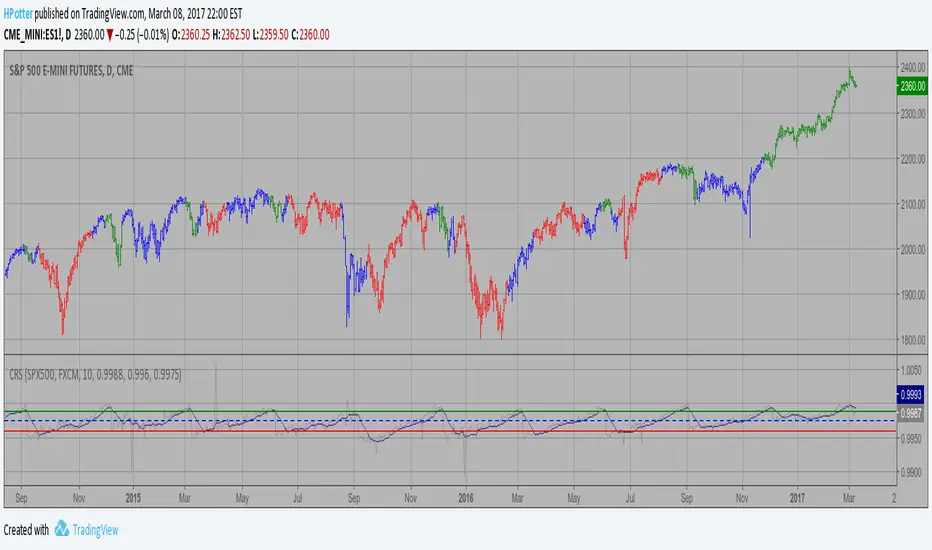
Comparative Relative Strength Strategy for ES
WARNING:
- For purpose educate only
- This script to change bars colors.

Combo Strategy 123 Reversal & Comparative Relative Strength This is combo strategies for get a cumulative signal.
First strategy
This System was created from the Book "How I Tripled My Money In The
Futures Market" by Ulf Jensen, Page 183. This is reverse type of strategies.
The strategy buys at market, if close price is higher than the previous close
during 2 days and the meaning of 9-days Stochastic Slow Oscillator is lower than 50.
The strategy sells at market, if close price is lower than the previous close price
during 2 days and the meaning of 9-days Stochastic Fast Oscillator is higher than 50.
Second strategy
Comparative Relative Strength Strategy for ES
WARNING:
- For purpose educate only
- This script to change bars colors.

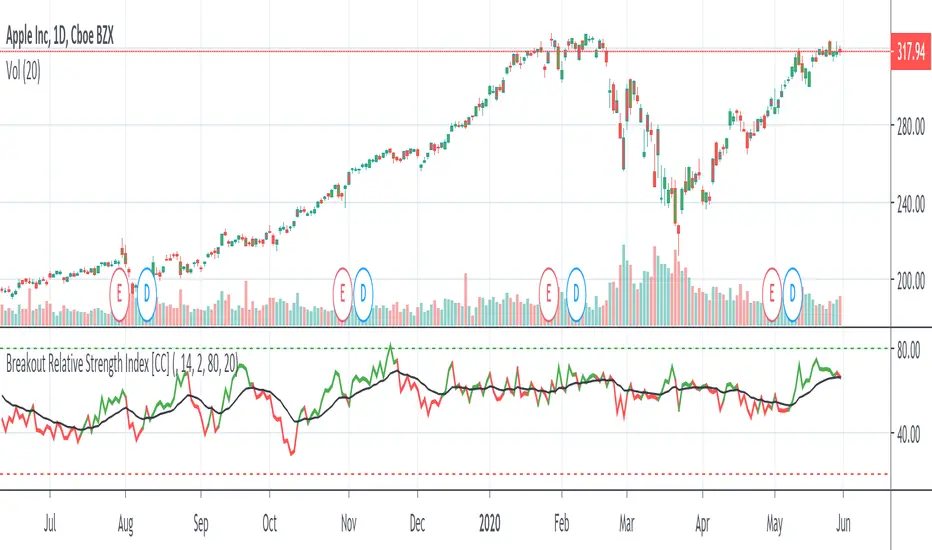
Breakout Relative Strength IndexIt isn't easy to determine if the price of a stock is about to break out. Here’s one way you can determine the relative strength of a breakout, enabling you to act early and realize higher profits.
This indicator was originally developed by Howard Wang Stocks & Commodities V. 33:09 (60–62)
Function : Relative Strength Index The relative strength index function is defined.
Now you can easily use length with mutable variables !!

IBD Relative strengtHThis code is to replicate the relative strength indicator as used on investors.com (on lists like the IBD 50, big cap 20 etc).
Let me know if any issues / any updates wanted.

Comparative Relative Strength Strategy Backtest Comparative Relative Strength Strategy for ES
You can change long to short in the Input Settings
Please, use it only for learning or paper trading. Do not for real trading.

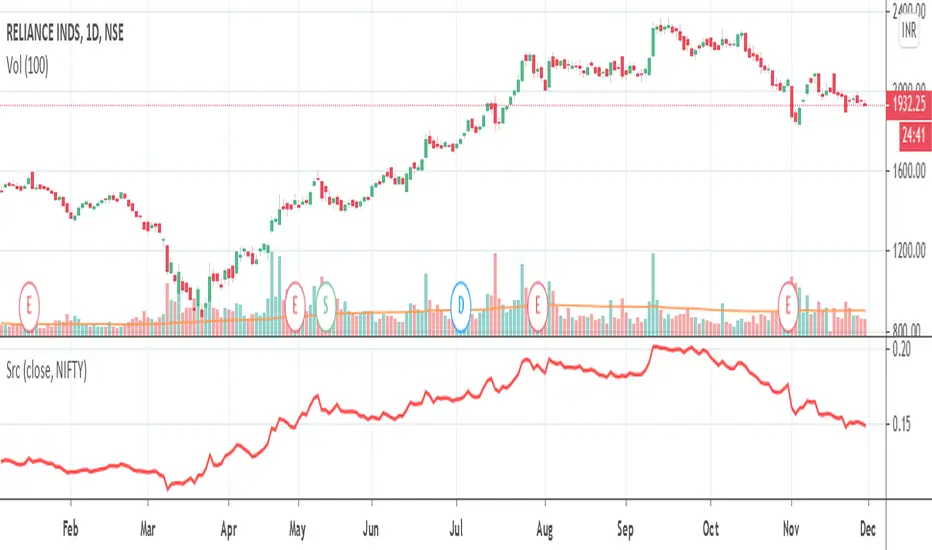
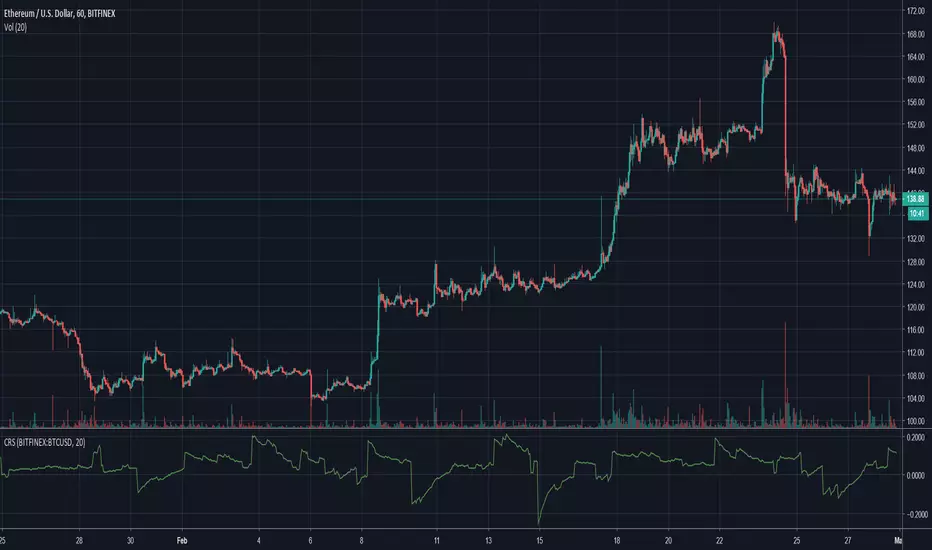
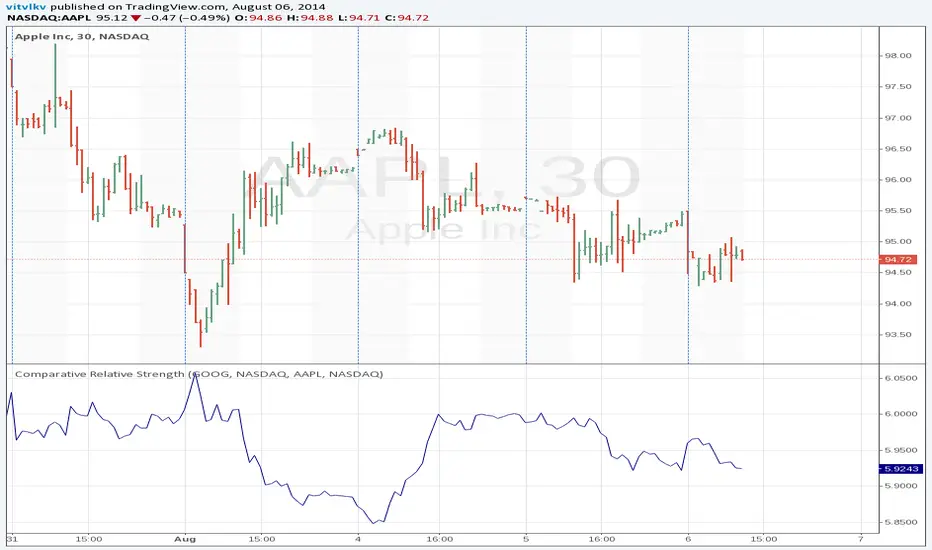
Comparative Relative StrengthThe Comparative Relative Strength indicator is calculated by dividing one security's price by a second security's price (the "base" security). The result of this division is the ratio, or relationship, between the two securities.
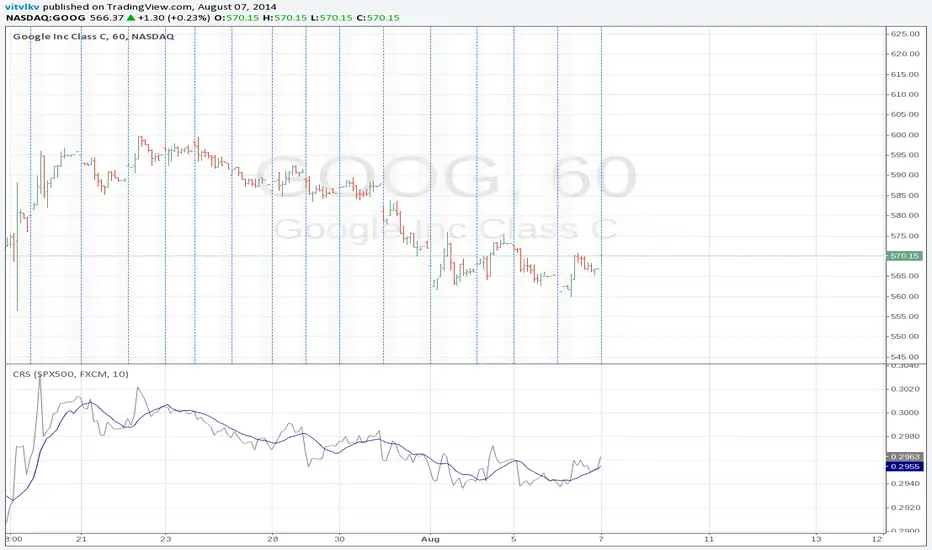

Comparative Relative StrengthThe Comparative Relative Strength indicator is calculated by dividing one security's price by a second security's price (the "base" security). The result of this division is the ratio, or relationship, between the two securities.
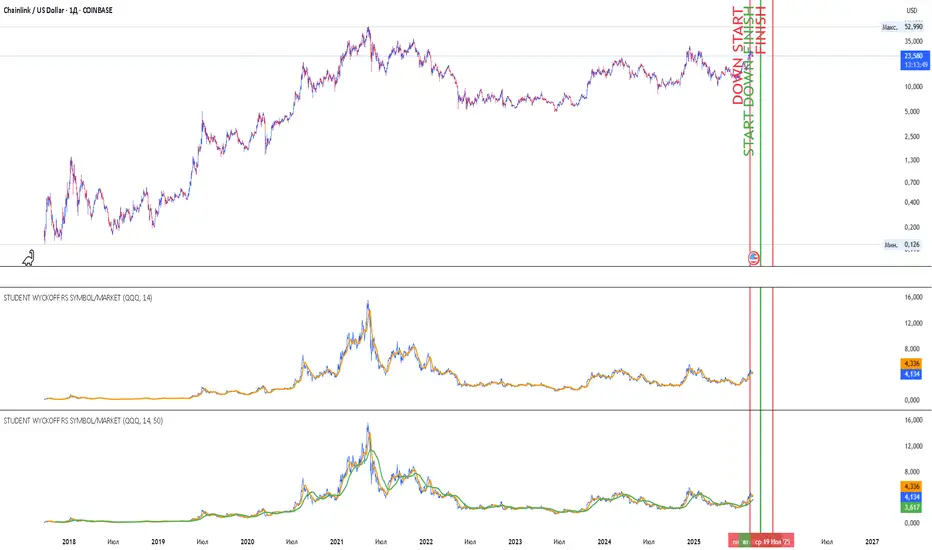
Student Wyckoff RS Symbol/MarketRelative Strength Indicator STUDENT WYCKOFF RS SYMBOL/MARKET
Description
The Relative Strength (RS) Indicator compares the price performance of the current financial instrument (e.g., a stock) against another instrument (e.g., an index or another stock). It is calculated by dividing the closing price of the first instrument by the closing price of the second, then multiplying by 100. This provides a percentage ratio that shows how one instrument outperforms or underperforms another. The indicator helps traders identify strong or weak assets, spot market leaders, or evaluate an asset’s performance relative to a benchmark.
Key Features
Relative Strength Calculation: Divides the closing price of the current instrument by the closing price of the second instrument and multiplies by 100 to express the ratio as a percentage.
Simple Moving Average (SMA): Applies a customizable Simple Moving Average (default period: 14) to smooth the data and highlight trends.
Visualization: Displays the Relative Strength as a blue line, the SMA as an orange line, and colors bars (blue for rising, red for falling) to indicate changes in relative strength.
Flexibility: Allows users to select the second instrument via an input field and adjust the SMA period.
Applications
Market Comparison: Assess whether a stock is outperforming an index (e.g., S&P 500 or MOEX) to identify strong assets for investment.
Sector Analysis: Compare stocks within a sector or against a sector ETF to pinpoint leaders.
Trend Analysis: Use the rise or fall of the RS line and its SMA to gauge the strength of an asset’s trend relative to another instrument.
Trade Timing: Bar coloring helps quickly identify changes in relative strength, aiding short-term trading decisions.
Interpretation
Rising RS: Indicates the first instrument is outperforming the second (e.g., a stock growing faster than an index).
Falling RS: Suggests the first instrument is underperforming.
SMA as a Trend Filter: If the RS line is above the SMA, it may signal strengthening performance; if below, weakening performance.
Settings
Instrument 2: Ticker of the second instrument (default: QQQ).
SMA Period: Period for the Simple Moving Average (default: 14).
Notes
The indicator works on any timeframe but requires accurate ticker input for the second instrument.
Ensure data for both instruments is available on the selected timeframe for precise analysis.